
Tools · Rust · Ratatui · updated 2026-10-11
dgxtop: designing a GPU terminal monitor that never shows a fake zero
dgxtop watches the CPU, GPUs, memory, disks, network and GPU processes of an NVIDIA DGX Spark, or any Linux host with NVIDIA GPUs, from a terminal. Version 2 is a complete rewrite around one rule: a value it cannot read is never shown as 0. This page explains the architecture behind that rule, and what each choice costs.
- stack
- Rust 1.92 · Ratatui · crossterm · NVML · SQLite
- platforms
- Linux x86_64 / aarch64 (glibc) · tested on a DGX Spark (GB10) and on an RTX 5080 + RTX 3060 workstation
- license
- Apache-2.0
- status
- v2 on main · first v2 release not tagged yet
- updated
Why a rewrite
Version 1 sampled hardware inside the UI loop, so a slow driver call froze the screen. It kept data, history and UI state in one shared struct, chose the CPU temperature by the names and scan order of thermal zones, and showed values it could not read as 0. The v2 specification lists ten findings like these and gives each a design answer:
| Finding in v1 | Answer in v2 |
|---|---|
| Processes identified by PID alone | A ProcessKey (host, boot, PID namespace, PID, start time), a held pidfd and a two-step confirmation |
| Missing values became 0 | Read status, sample kind, quality and freshness on separate axes; a missing value is null with a reason |
| Unified-memory semantics mixed up | System RAM, GPU framebuffer and per-process allocations kept apart |
| Bandwidth estimated from utilization | Measured, derived and estimated values kept apart; no throughput without a byte counter |
| Interval and totals assumed, not measured | The effective interval confirmed by the scheduler; real elapsed time and counter deltas |
| History windows misaligned | Time buckets that carry the boot, the coverage and the gaps |
| One PID on several GPUs counted twice | Host CPU and memory sampled once per ProcessKey, then joined to each GPU |
| Installer did not verify downloads | Checksum and archive checks, with the previous binary kept for rollback |
| Sampling blocked the UI | Control, sampling and rendering separated; drivers isolated in their own processes |
| Builds not reproducible | A committed Cargo.lock, a pinned toolchain and release gates |
The rewrite was specified before it was written: 40 requirements, 15 work packages and 40 acceptance cases. It was then built as an eight-crate Rust workspace against a fixed core contract, roughly 157,000 lines of Rust with 1,373 tests.
What it shows
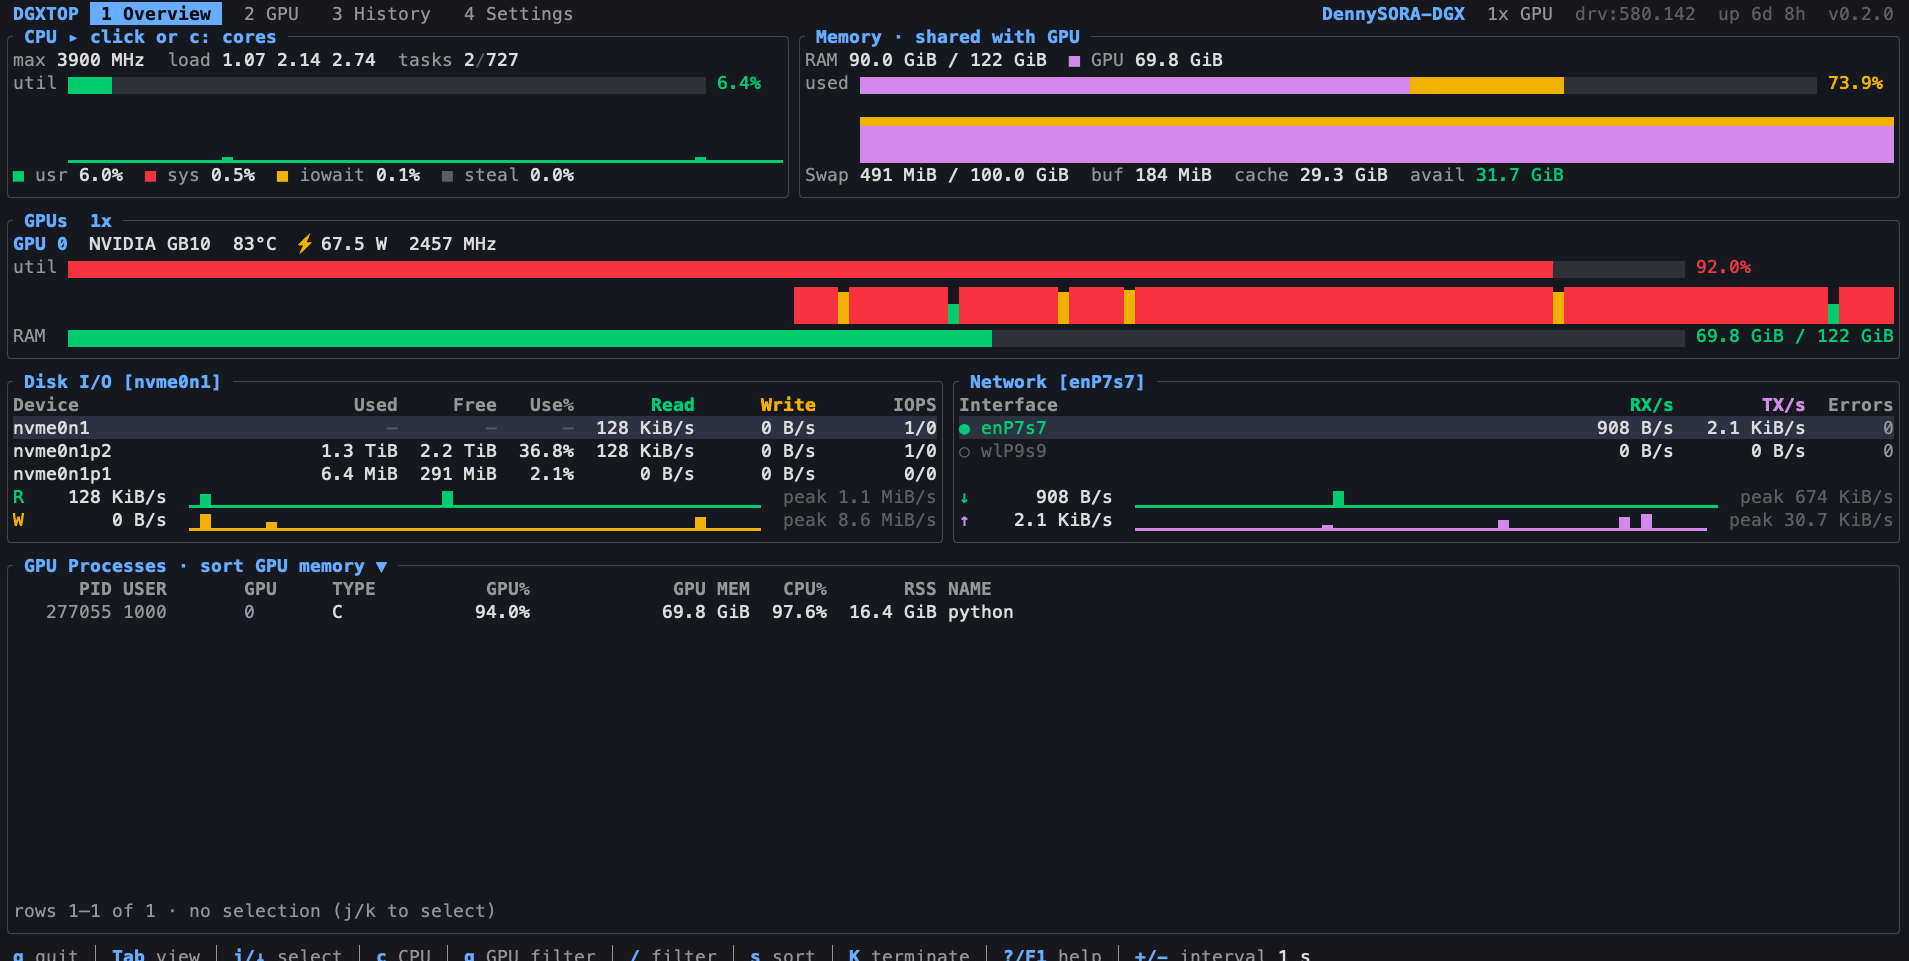
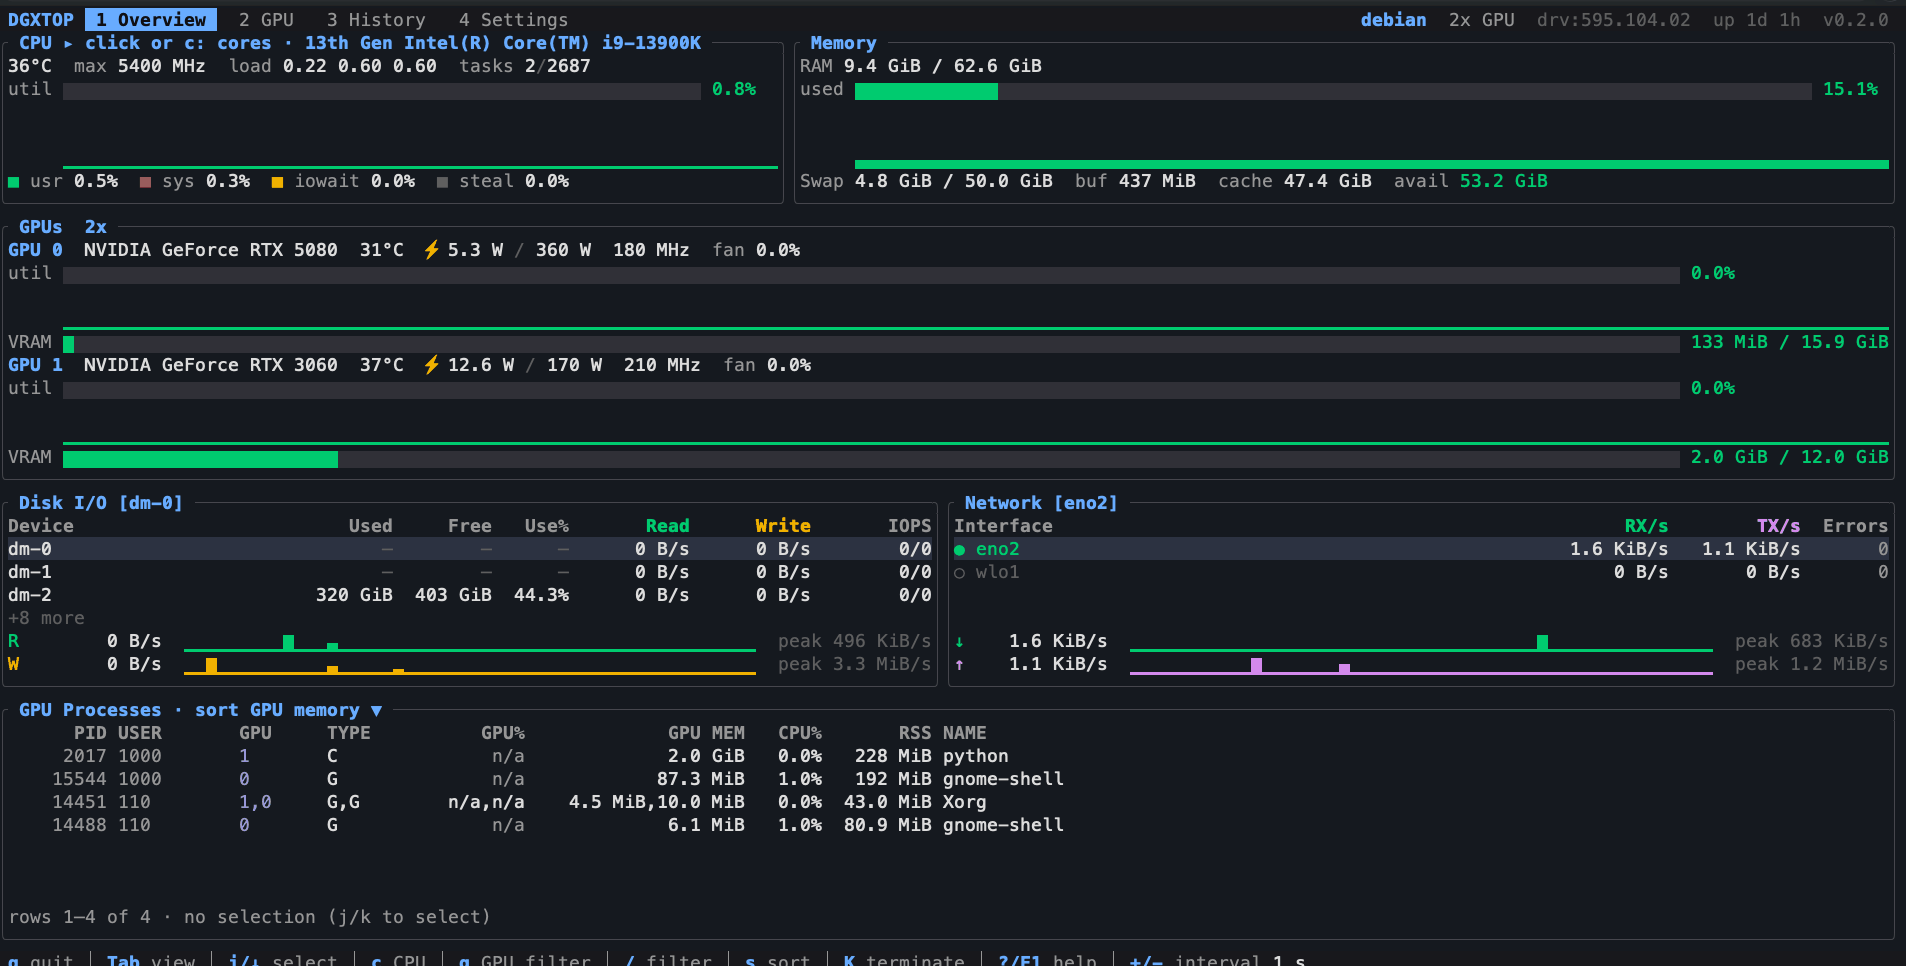
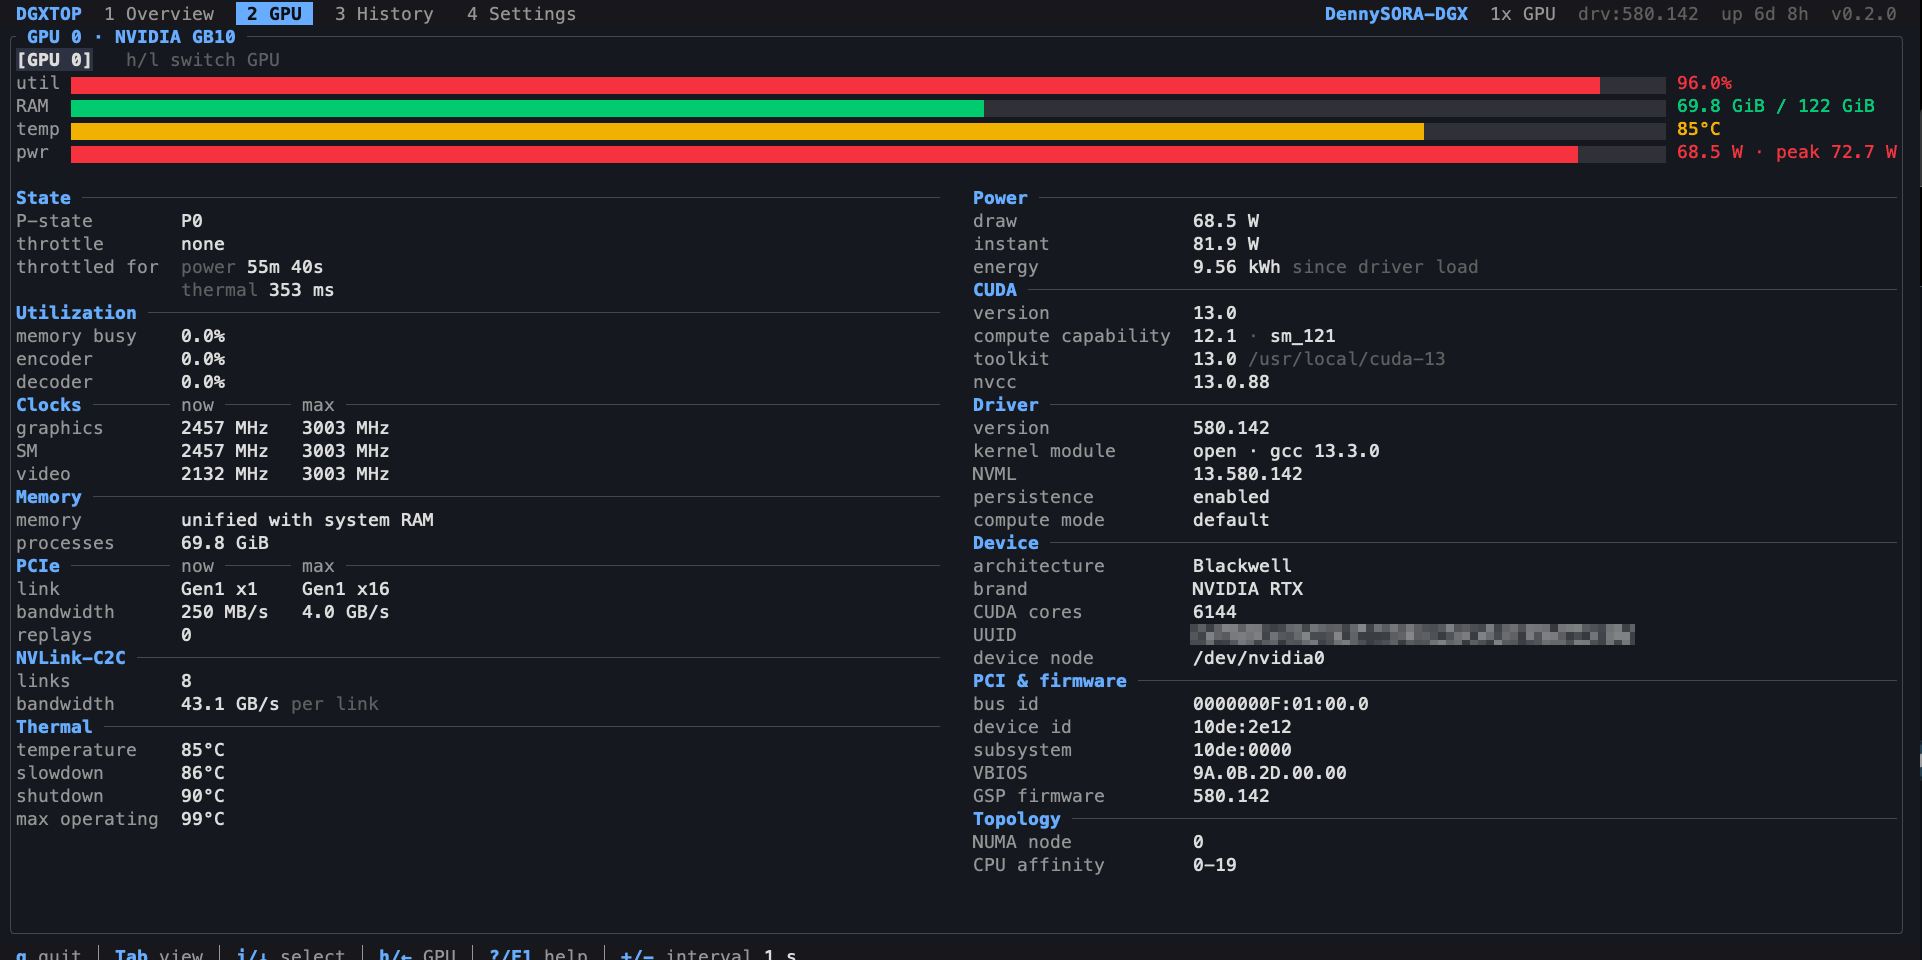
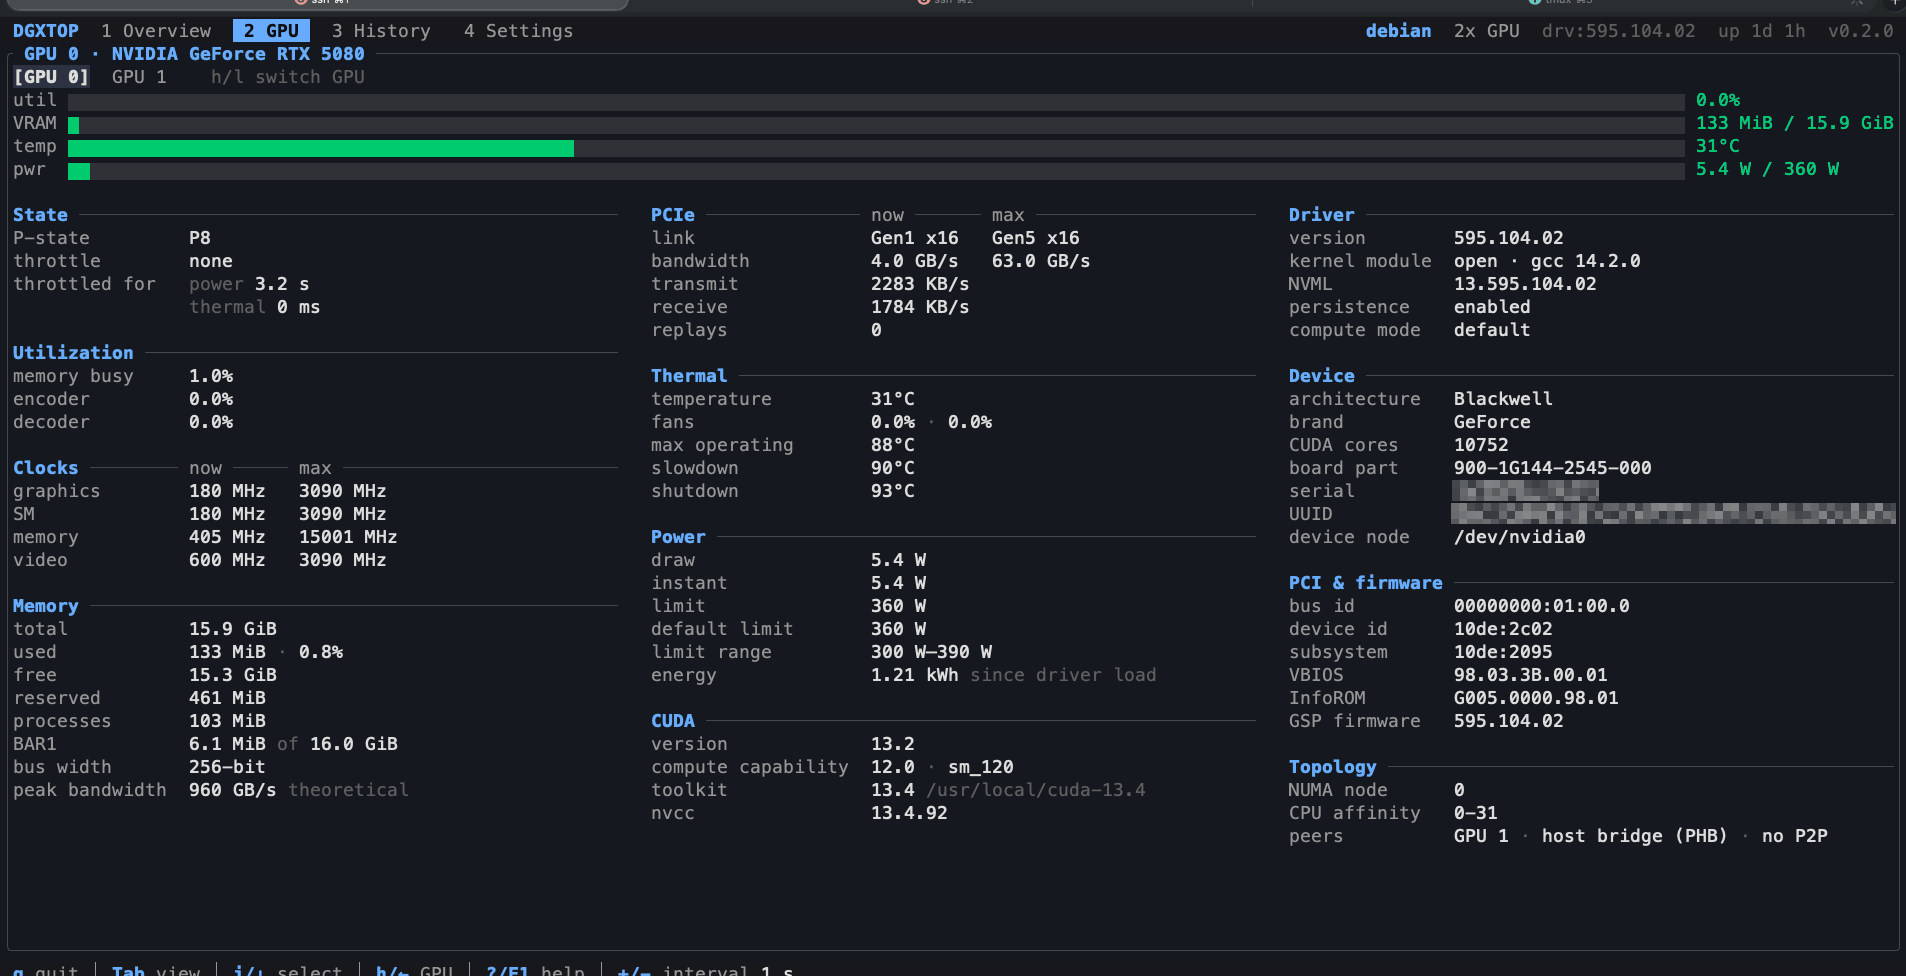
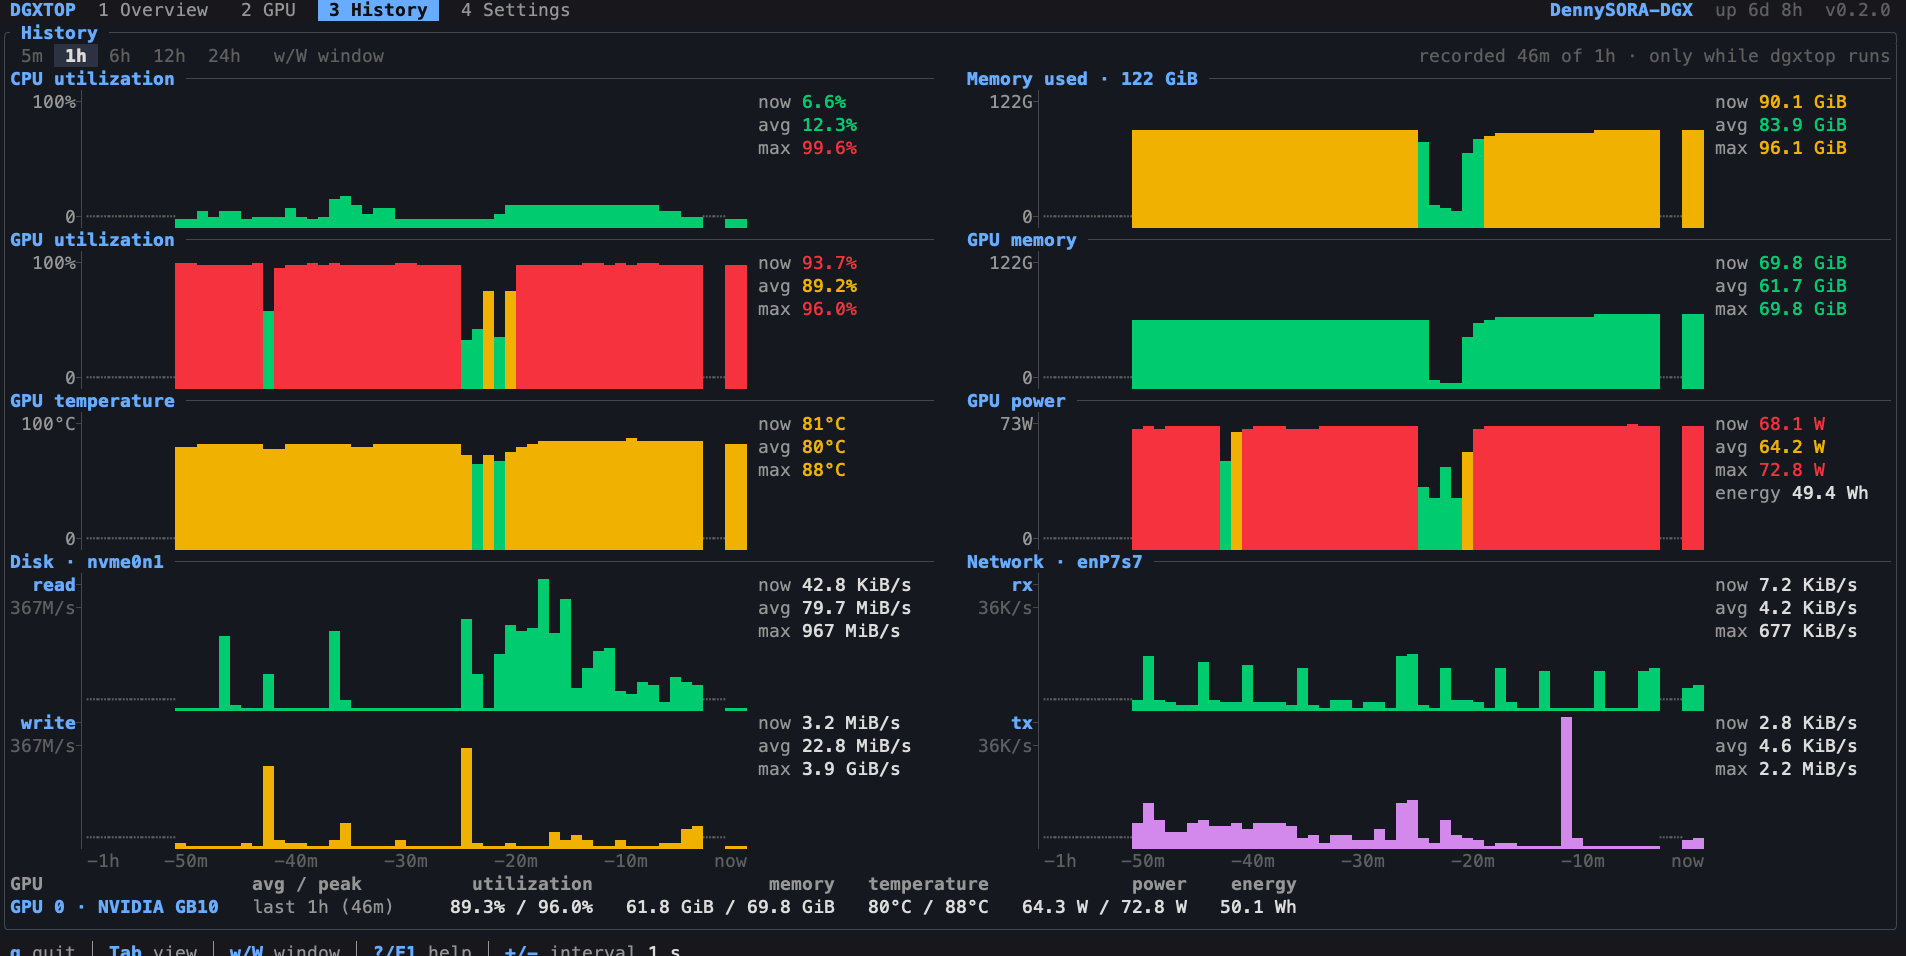
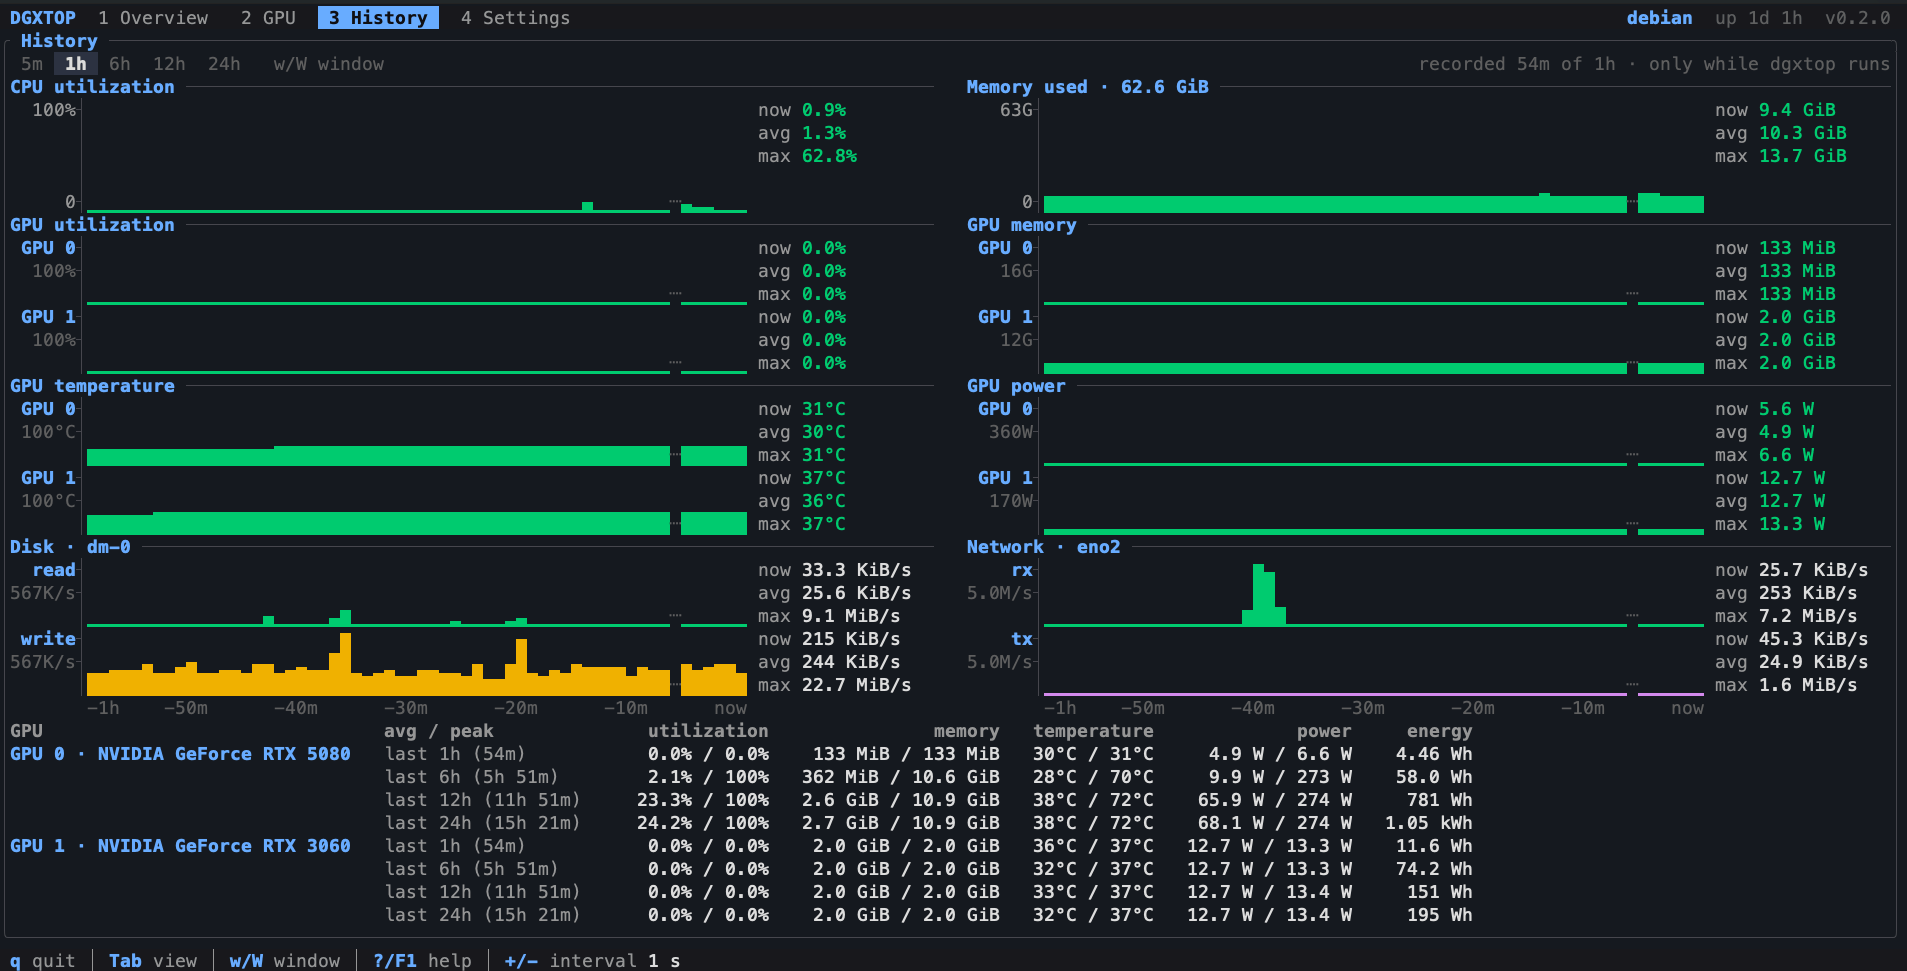
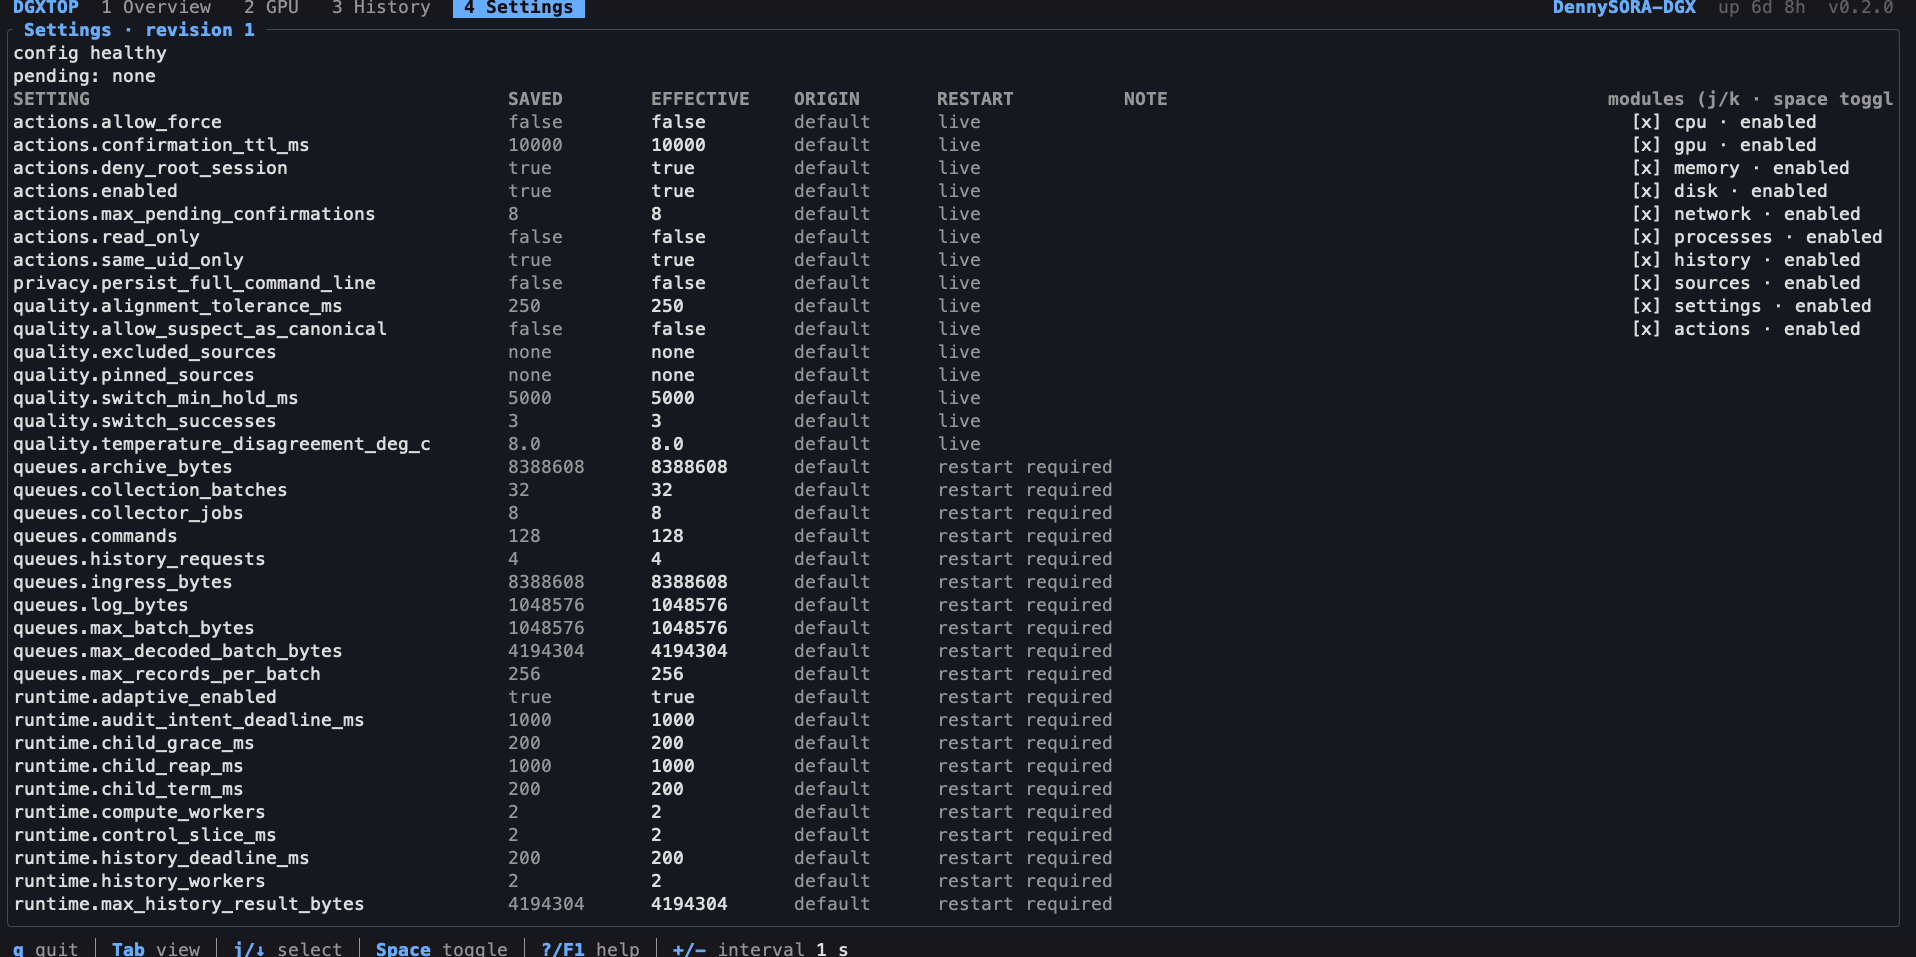
Four tabs: Overview, GPU, History and Settings. These screenshots come from the two machines it was tested on.
Six components, two paths
Every value travels the data path, and every user intent travels the control path. The Manager is the only writer: it alone holds the store writer and the process-action port, so neither the Viewer nor the Controller can change data or send a signal.
data path
- Linux + NVIDIA driver/proc · sysfs · NVML
- Adapter hostsone process each
- procfs
- hwmon
- thermal
- powercap
- NVML
- network
- filesystem
- Collectornormalize · de-duplicate · arbitrate · rates
- Managerthe only writer
- Storesnapshots · history · config · audit
- Managerprojection
- Viewerimmutable view model · Ratatui
control path
- Controllerkeys · mouse · CLI → typed command
- Managervalidate · authorize
- config · scheduler · action adapterpidfd for signals
- audit + resultdurable before any signal
- Store → Viewerthe outcome is shown
| Component | Its one job | Must not |
|---|---|---|
| Adapter | Talk to one driver or kernel interface; return native values with their source, timing and errors | Pick an authoritative value, average sources, write the store, render |
| Collector | Normalize units, de-duplicate proven aliases, arbitrate, derive rates | Call driver internals, run SQL, change settings, send signals |
| Manager | Schedule sampling, own policy and configuration, authorize commands, commit data, project view models | Lay out the screen, or wait on a blocking driver call |
| Store | Keep snapshots, history, configuration and the audit log | Choose sensors, run commands |
| Viewer | Lay out display modules and draw immutable view models | Sample, read or write the store, compute rates, authorize anything |
| Controller | Turn keys, clicks and flags into typed commands with stable IDs | Decide sources, send signals, draw |
Ten display modules register at compile time and receive only their view model and their area of the screen. A module that panics is isolated as a module error instead of taking sampling down with it.
A hung driver stalls one host, not the screen
dgxtop parent process
- terminal · input and render, at most 4 fps
- Manager · 2 ms control slices
- supervisor · pipes and reaping
- collector workers × 2
- hot store · single writer
- history queries × 2
- config · audit · archive · log
- process action worker
adapter hosts · one process each
- procfsfresh
- hwmonfresh
- thermalfresh
- powercapfresh
- NVMLtimeout
- networkfresh
- filesystemfresh
↔ anonymous pipes · length-prefixed JSON · ≤ 1 MiB per frame
a host that keeps failing
- degraded
- circuit open
- backoff 1 s · 2 s · 4 s … 60 s
- probe
- warmup
not reaped → quarantined · at most 8 hosts
A timeout says a result is late. It does not cancel the call: a thread stuck inside a vendor library cannot be stopped safely. So every live adapter runs in its own resident child process, the same binary started as an adapter host, and talks to the parent over anonymous pipes in length-prefixed JSON frames of at most 1 MiB.
A host that misses its deadline turns degraded. After three failures a circuit breaker opens and retries back off 1, 2, 4 … 60 seconds. A host is replaced only after it has been reaped; one that cannot be reaped is quarantined, and there are never more than eight.
The parent runs a fixed set of threads and no async runtime: nothing here does network I/O, and spawn_blocking would only hide the same uncancellable call behind a future. One 256 MiB budget covers all managed data, and every queue has a byte limit as well as an item limit, because a bounded channel counts messages, not bytes.
Explainable sources, never an average
Linux can expose one sensor through several interfaces, and a label does not prove what it measures: temp1 is not necessarily the CPU. dgxtop first decides what a reading means, as a metric key of host, boot, entity, metric and scope, and only then compares readings of the same key.
- map meaning
- normalize units
- validate
- check freshness
- de-duplicate origins
- rank candidates
- detect conflict
- hysteresis · 3 wins · 5 s
- commit + explanation
possible results
- selected · 68 °C · hwmon
- source conflict · A 68 °C / B 42 °C
- unsupported
- read failed
- stale
55 °C· never an average
four separate axes, never one trust score
- read status
- sample kind
- quality
- freshness
| Situation | What dgxtop does | What you see |
|---|---|---|
| B is the SoC zone | Different metrics; nothing to compare | CPU package 68 °C, SoC 42 °C |
| B is a proven alias of A | One sensor reached two ways, counted once | One value, with a note on the mismatch |
| A and B are independent, equal and aligned | 26 °C apart, beyond tolerance: a conflict, value null | Source conflict with both readings, never 55 °C |
| B reports a fault | B excluded, A selected | 68 °C from A, with B marked faulty |
A switch to another source needs three consecutive wins and at least five seconds, so a value does not flap between sensors. Read status, sample kind, quality and freshness stay four separate axes instead of one trust score.
Exact history
A rate is the difference of two u64 counters divided by the real elapsed time on CLOCK_BOOTTIME, which keeps counting through suspend. A counter reset, a new boot or a source change starts a new segment instead of producing a negative or invented rate.
A one-minute rollup cannot know when inside an interval the bytes moved. Totals therefore count only intervals that lie fully inside a window, and an interval that crosses a minute boundary is kept as an exact bridge and counted once, never split in proportion.
Gauges are time-weighted, a value counts only until its source’s stale deadline, and gaps stay gaps. History lives in history.sqlite3 for seven days, at most 1 GiB, so earlier runs are charted too. The archive writes with synchronous=NORMAL, the action audit with FULL: losing the last second of a chart is acceptable, losing the record of a signal is not.
Protected process termination
- Kselect a GPU process
- preparesame user · no root · not PID 1, dgxtop or its hosts
- pidfd_openverify the /proc identity
- confirm10 s single-use token · y
- audit intentSQLite synchronous=FULL
- pidfd_send_signalSIGTERM
signal sent
- exit observed
- still running
crash after the intent → unknown, never resent
SIGKILL off unless allow_force
Terminating the wrong process is the worst thing a monitor can do, so termination is a two-step, audited action on a ProcessKey (host, boot, PID namespace, PID and start time), never on a row index or a bare PID.
Prepare checks the user, refuses root sessions, PID 1, dgxtop and its own hosts, opens a pidfd and re-checks the identity in /proc. The confirmation is a single-use token valid for 10 seconds. The intent is written with synchronous=FULL before the signal, and the signal goes through the pidfd held since preparation, so a reused PID cannot be hit.
The result says signal sent apart from exit observed. A crash between the durable intent and the outcome is recorded as unknown and never resent: a database commit and a system call share no transaction, so the honest guarantee is at most once. SIGKILL stays off unless actions.allow_force is set, and --read-only turns every action off.
Budgets and overload
Every allocation dgxtop manages draws on one 256 MiB ledger, split by purpose. These are admission limits, not measured memory: allocator overhead, thread stacks and the NVIDIA library come on top, which is why the specification sets a separate 384 MiB target for the whole process tree.
| Partition | MiB | Holds |
|---|---|---|
| Catalog and metadata | 24 | Names, tombstones, arbitration state |
| Raw candidates | 32 | 60 s of evidence for source diagnostics |
| Hot state | 16 | 512 series, 256 processes, 1,024 GPU links |
| Full-resolution history | 32 | The last 300 s |
| Minute aggregates | 96 | 24 h of rollups, source changes and gaps |
| Ingress | 8 | Every live IPC and decoding buffer |
| Presentation | 12 | View models and the formatting cache |
| History queries | 16 | Snapshots pinned by running queries |
| Control and reserve | 20 | Commands, archive journal, log, safety reserve |
- normalfull rate
- pressuredoptional work stops · 2 fps
- throttledqueries limited · period stretched
- recoveringone step per 30 s
Under load dgxtop degrades visibly instead of silently. Pressure stops optional work and draws at most 2 fps; throttling limits queries and stretches the sampling period, which a banner shows as effective against configured. Recovery takes one step per 30 healthy seconds, and missing samples are never back-filled.
Boundaries and verification
- dgxtop-runtimehosts · IPC · workers→ dgxtop-core only
- dgxtop-adaptersprocfs · NVML · pidfd→ dgxtop-core only
- dgxtop-collectorsarbitration · rates→ dgxtop-core only
- dgxtop-storehistory · SQLite→ dgxtop-core only
- dgxtop-manageruse cases · sessions→ dgxtop-core only
- dgxtop-uiRatatui · keymap→ dgxtop-core only
enforced in CI · check_boundaries.py
The workspace has eight crates. Each implementation crate depends only on dgxtop-core, and only the composition root sees them all; a CI script reads cargo metadata and fails the build if a crate reaches another. The core never depends on NVML, libc, SQLite or the UI.
Format, lint, 1,373 tests (1,372 on aarch64), the dependency boundaries and the real-hardware suites pass on a Debian 13 workstation with an RTX 5080 and an RTX 3060, and on a DGX Spark. The acceptance report tracks 40 cases: 12 pass, 24 are not run yet (mostly opt-in end-to-end suites), and 4 are blocked on a tagged release, three 30-minute benchmark runs and a 72-hour soak. Until those exist, no platform is called validated, and the performance numbers stay targets.
Trade-offs
- A process per adapter, not a thread. More resident memory and IPC, in exchange for a hung driver that cannot freeze anything else.
- Fixed threads and crossbeam channels, not an async runtime. There is no network I/O to justify one.
- A compile-time registry, not plugins. No unstable Rust ABI and no new attack surface for adapters and display modules.
- Conflicts shown, not averaged. Less tidy, but never a number that no sensor reported.
- At most one signal, not retries. An unknown outcome is shown as unknown.
- Redraw on change, at most 4 fps. A monitor does not need 60 fps, and a slow terminal must never block input.